The candlestick chart is not what made Japan's richest man
The investing method he built on human psychology is Sakata's five methods.
Honma is said to have stationed men every six kilometers on hilltops and rooftops.
Sakata's five methods are the trading rules left behind by the rice merchant once called the richest man in Japan. The candlestick chart that carries those rules today was not something he used while he was alive. Honma Munehisa was born in 1724 into a wealthy merchant family in Sakata, in what is now Yamagata Prefecture. He was the youngest son, yet he took over the family business at twenty three and went to the rice market at Dojima in Osaka. In 1730 the shogunate authorized a spot market in rice bills there, along with a futures market in representative brands of rice. It already had a membership system and a clearing function, which is why it is described today as the forerunner of organized futures exchanges.
The men standing every six kilometers
Two things are credited to Honma. He gathered a century of weather, rice prices and harvest records and worked out the statistics, and he learned the Osaka price before anyone around him did. That second one is where the story of signalmen on hilltops and rooftops, relaying prices by flag, comes from.
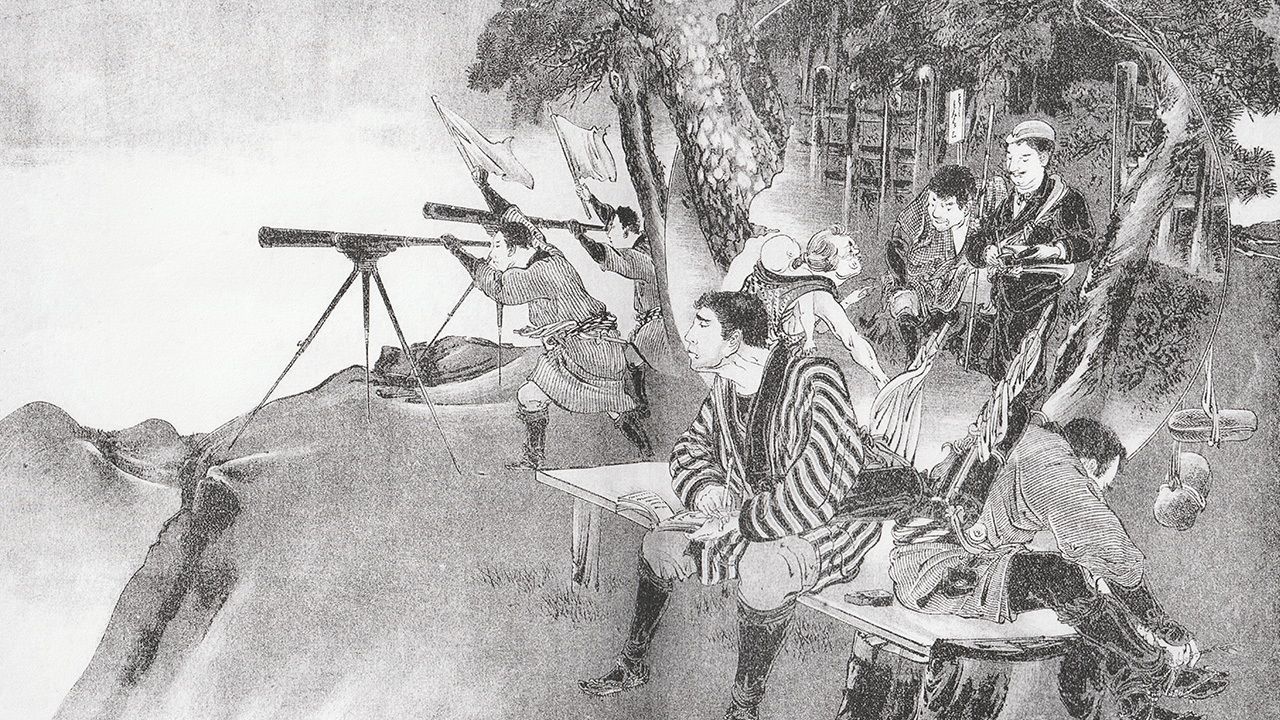 Ahead of the times: flag-waving communication and Japan's Dojima Rice Exchange (Nippon.com, retrieved 2026-08-11)
The flag network was real. It does not appear to have been one man's invention. Around 1745 a rice broker named Gensuke arranged for signals to be sent from Honjo, and from there it became shared equipment that the brokers of the market used together. The gaps between relay points ran from four to twenty two kilometers. In later reenactments an Osaka price reached Wakayama in three minutes, Kyoto in four, and Hiroshima in under forty. The shogunate banned the practice in 1775 and reissued that ban until 1865. Put simply, a price that arrived days early was not a technique but a position, and that position was illegal for much of the period.
- 1730
The shogunate authorizes spot trading in rice bills and futures trading in leading brands at Dojima
- around 1745
The broker Gensuke begins sending Osaka prices out by flag signal
- 1775
The shogunate bans flag communication, and reissues the ban until 1865
- 1803
Honma Munehisa dies
- 1868
The Meiji era begins, and by Nison's account candlestick charts appear around this time
Two generations sit between the year Honma died and the year the candlestick chart shows up.
Japan Exchange Group on Dojima · Nippon.com · The Data Visualisation Catalogue · retrieved 2026-08-11
The five methods and 1868
The five methods are sanzan, sansen, sanpei, sanku and sanpo. Three peaks at the top is sanzan, which resembles what we now call a head and shoulders. Three valleys at the bottom is sansen, three rising candles in a row is sanpei, and three gaps in a row is sanku, a warning that the move is near its end. The last one, sanpo, says to stand aside while the market goes sideways. Those five appear to have been drawn onto candles only after his death. Steve Nison, who introduced candlestick charting to the West, dates the charts to around 1868, when the Meiji era began. Honma died in 1803.
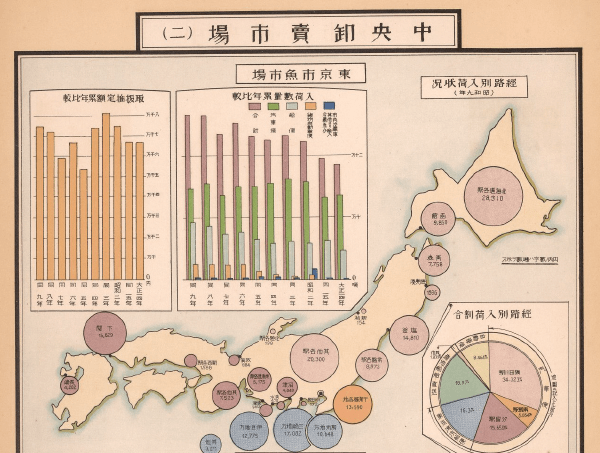 Japanese contributions to data visualisation (The Data Visualisation Catalogue, retrieved 2026-08-11)
That source says there is hardly any evidence that Honma ever used the chart, and treats today's candles as cumulative work by many hands across several generations. What he did leave, in 1755, is San-en Kinsen Hiroku, a book about the mind of the market rather than a book of pictures.
A book from 1755 and a picture from 1868
The method kept his name, and the picture was attached later. What the record actually supports is the century of data and the price that arrived days early. So the question of what to look at today splits here. If the edge lives in the shape on the chart, the five methods are still a working tool, and if it lives in the position, then what the flags did back then is now divided between regulation and line speed.
- Honma Munehisa, who left the five methods, died in 1803, and candlestick charts appear only around 1868.
- The story as told is that this method made him the richest man in Japan.
- What the record supports is a price that arrived days early, carried by a network the shogunate banned in 1775.
Sources
- Original post Meru · 2026-08-11 · the post laying out Honma Munehisa and Sakata's five methods
- Japan Exchange Group Dojima page: in 1730 the shogunate authorized spot trading in rice bills and futures in leading brands
- Nippon.com The start and banning of flag signalling, relay distances and speeds · retrieved 2026-08-11
- The Data Visualisation Catalogue Cites Nison's research dating candlestick charts to after 1868 · retrieved 2026-08-11
- Wikipedia Honma Munehisa 1724 to 1803, San-en Kinsen Hiroku in 1755 · retrieved 2026-08-11
Retrieved 2026-08-11 · dates and the authorization of trading follow Japan Exchange Group and Wikipedia, and the flag signalling times are from later reenactments.
This author's record
- BullWhy did China build a 2008 model when it already held ASML's 7nm scanner?
- BullHouthis strike two Saudi-owned tankers by name, following through on a five-day…
- BullMeru: Alphabet raises 2026 capex to $195-205B even as free cash flow turns nega…