88.6%, 83.1%, and 62.0%
#IranWatch🇮🇷: Today, I measure Iran’s inflation at a PUNISHING 107%/yr.
That's the WORLD’S 2ND HIGHEST rate, only behind Venezuela.
I REMAIN THE ONLY ACCURATE SOURCE FOR INFLATION MEASUREMENTS IN IRAN AND VENEZUELA.
Four different numbers are circulating for the same inflation in the same country.
The middle two compare last month with the same month a year earlier and the bottom one compares two twelve-month averages. The top one is worked back from an exchange rate, so it is a different method altogether.
Statistical Centre of Iran and Central Bank of Iran, 22 May to 21 June 2026; Hanke's figure from his post of 2026-08-12; retrieved 2026-08-12
One government, two agencies, four numbers
Iran has two bodies that measure prices. The Statistical Centre of Iran and the Central Bank of Iran each run their own survey and publish their own result.
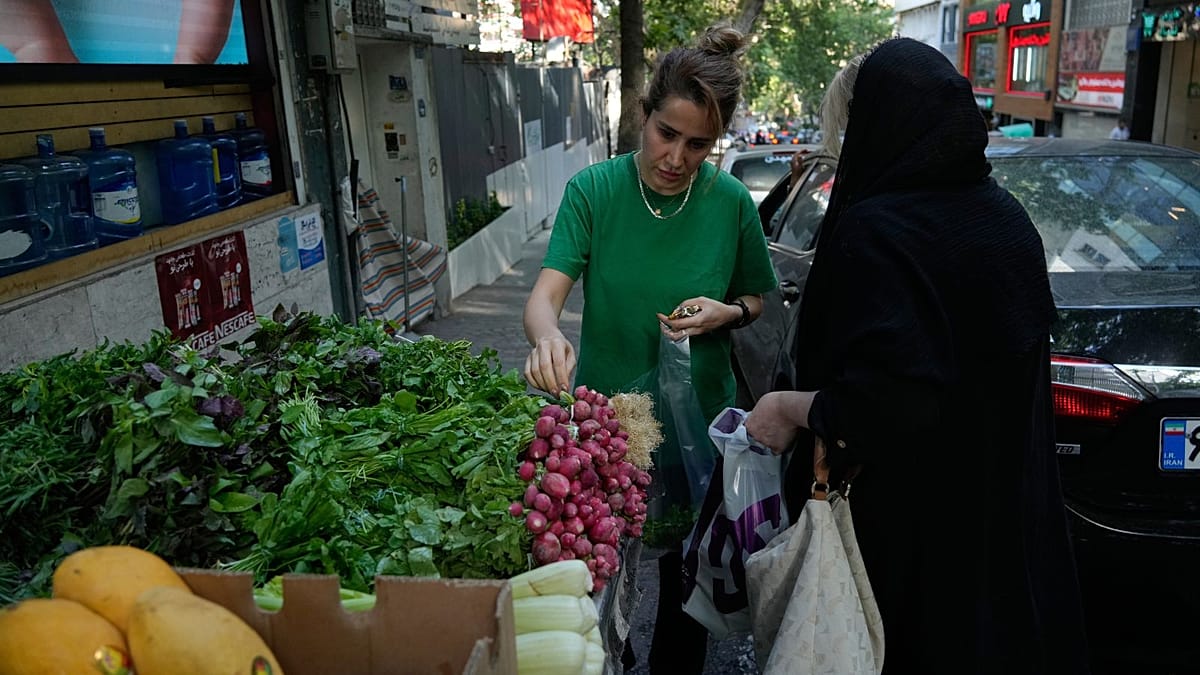 Iran's inflation spiral deepens as rial slides and tensions rise (Euronews, 2026-06-30)
Euronews sets out the difference between the two. The baskets of goods that stand in for what households buy are not the same, the weight given to each item is not the same, and where and how the prices are collected is not the same either. The result is a 4.3 point gap on the annual measure and a 5.5 point gap on the year-on-year one.
Year-on-year and twelve-month average answer different questions
The statistics centre publishing both rates in the same release is not a slip. The two numbers answer different questions. The higher one compares a single month with the same month a year earlier. It shows how fast prices are climbing right now. The lower one compares the average of the last twelve months with the average of the twelve before that. It shows how much heavier a household budget has become over a year. Put simply, the first is a speedometer and the second is an odometer. If the car only recently sped up, the speedometer is already high while the odometer is still low. In a country where prices took off last winter, a wide gap between the two is the normal result rather than a contradiction. Hanke's figure is none of the three. He takes black-market exchange rates daily and works back to a price level through purchasing power parity. His claim is that in a country whose currency is collapsing this method moves faster than government statistics.
Subsidised prices and a controlled exchange rate sit inside the index, so the published number understates what households actually pay.
Working back from a market exchange rate moves earlier and further than prices do while a currency is breaking down.
What the two readings dispute is not how high inflation is but what should be called inflation.
What the next release from the Statistical Centre of Iran will say
So which of the four should an investor watch. The answer depends on what the question is. Anyone tracking tankers and the direction of sanctions talks wants to know how long the government can hold out, and for that the twelve-month average is the right one. Anyone trying to see what is happening inside the country this month wants the year-on-year figure. Picking one number and calling the rest wrong collapses three separate questions into one.
- Steve Hanke of Johns Hopkins says he measures Iranian inflation at 107% a year.
- That runs far above what the Iranian government publishes, so it reads as a claim that the official statistics cannot be trusted.
- But the Iranian government does not have one number either. Its statistics centre published two rates for the same month, and the central bank produced two more, because each compares a different thing with a different thing.
Scheduled for gradingAwaiting grading
Sources
- Original Steve Hanke (@steve_hanke), measuring Iranian inflation at 107% a year, 2026-08-12
- Coverage Xinhua English, Statistical Centre of Iran figures of 88.6% year-on-year and 62% over twelve months, 2026-06-28
- Coverage Euronews, the gap between the statistics centre and the central bank and why it exists, 2026-06-30
Retrieved 2026-08-12. The Statistical Centre and central bank figures cover the third Iranian month, 22 May to 21 June 2026; the two months since were not confirmed in English-language media at the time of writing. Hanke's 107% is the value in his post of 2026-08-12, so the reference periods differ and the numbers are not a same-month comparison.