For the 3x leveraged chip ETF to get back to even, the index has to rise 170%
Global leveraged and inverse ETFs tracking SK Hynix now hold ~$5.5 billion in assets, the most of any single stock worldwide.
In total, semiconductor-related names account for ~$21.0 billion in leveraged and inverse ETF assets.
The largest single-stock leveraged and inverse ETF pool in the world now tracks SK hynix. It holds about $5.5bn. Behind it sit Micron at $5.1bn and Nvidia at $4.8bn, and the largest non-chip name, Tesla, at $3.7bn.
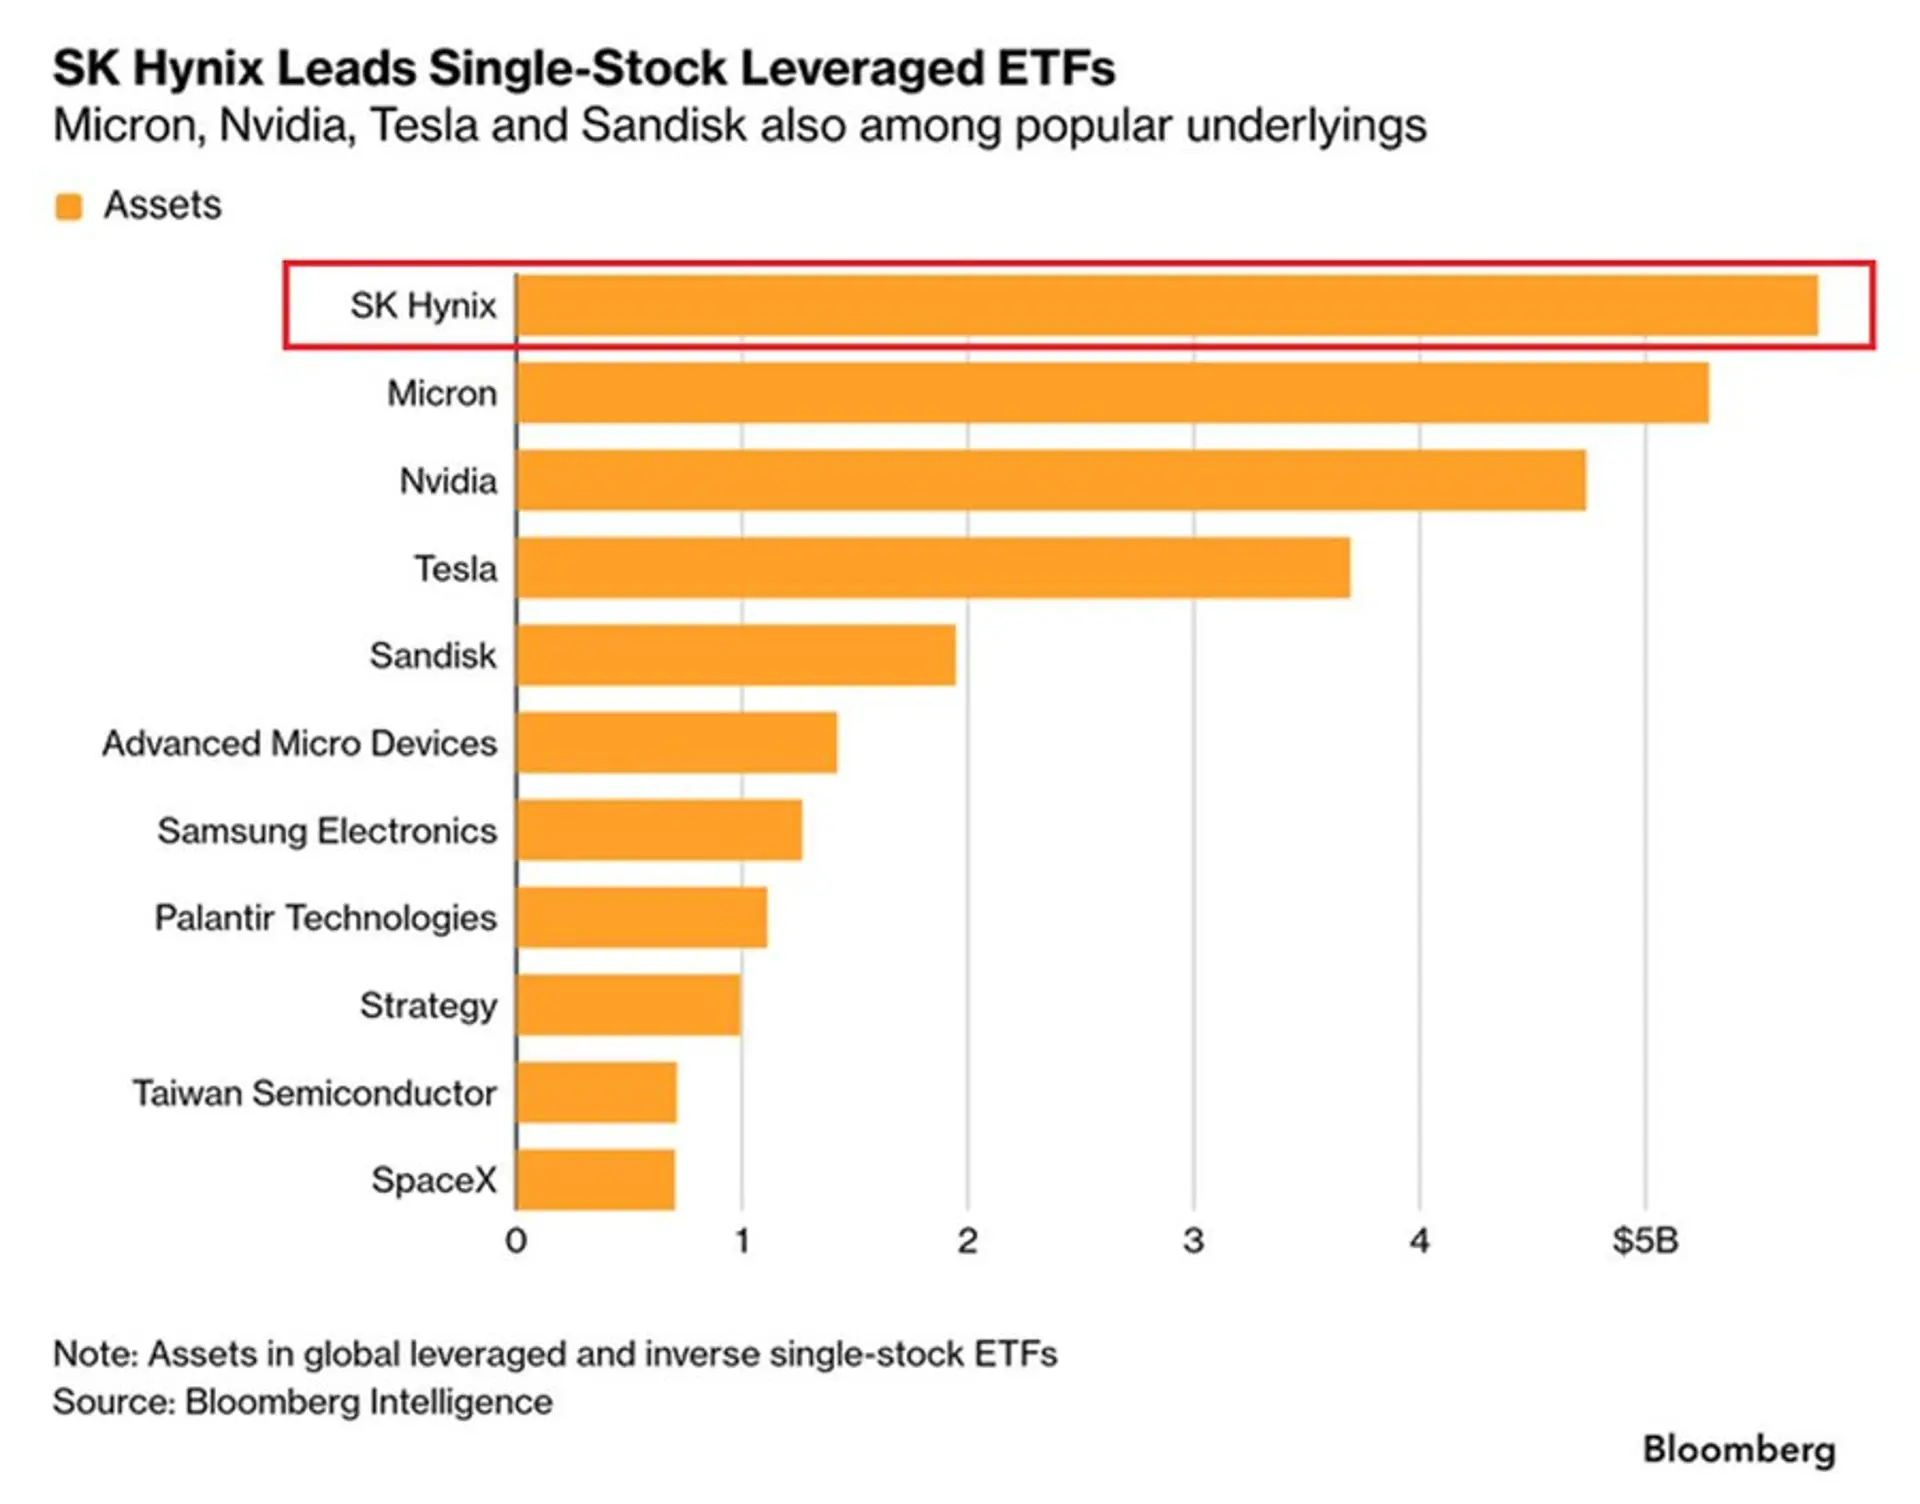 Cash floods into leveraged semiconductor ETFs, giving SK Hynix the world's largest single-stock exposure at $5.5 billion (Bloomingbit, 2026-08-03)
A leveraged ETF is built so that a 1% move in the underlying index turns into a two or three times larger move in the fund. An inverse fund does the opposite and rises when the index falls. Count both together and you get the size of the directional bet riding on that stock, and the stock carrying the largest one in the world today is listed in Seoul.
Where the money sits
Add up the chip-related names and about $21.0bn is parked in products like these. Three of the top four single names are semiconductors, and the fourth, Tesla, is tied to the same story through self-driving chips. That is as far as the original post goes. The question it leaves open is when the money arrived, and the answer changes how the figures read.
The money that came in during July
July was the month the Philadelphia semiconductor index fell 21%. It was the worst month since October 2008, and $2.2 trillion of market value left the index. In that same month the chip ETF that moves three times as far took in $6.9bn, the largest monthly intake since the fund was created.

Buying into a fall is an ordinary decision. Doing it through a fund with a multiple attached changes the arithmetic.
What multiplying down does
Measured from 22 June, the plain index-tracking fund is down 25% and the leveraged one is down 63%. It did not fall three times as far; it fell further than that. Every one of July's 22 trading days swung at least 2% intraday, and 60-day realised volatility reached 66%, the highest since 2020. A fund like this resets its multiple back to the starting figure at each close, and in that reset the loss on down days outweighs the gain on up days. Put simply, a sum that halves and then doubles is back where it started, while an account that followed the same path at three times the pace is not.
This is the rise each needs to get back to even. What multiplies down does not divide back up, and the choppier the stretch, the more that difference grows on its own.
Tech Times tally · 2026-07-29 · measured from 22 June
 SOXL slid 63% while chip stocks lost 25%: why recovering the index won't fix it (Tech Times, 2026-07-29)
What August does to the SK hynix leveraged pool
The day the index gets back to where it was and the day the account does are not the same day. If these pools keep growing through an August rebound in chip stocks, investors are accepting that gap and betting on direction anyway. If the pools shrink during a rebound, the record will show that more people took what was left and walked. Either way, one fact stands: Korean retail money has placed the largest directional bet in the world on its own country's flagship stock.
- Korean retail money now carries the largest directional bet in the world on its own country's flagship stock. That also means the volume forced out in a shakeout has grown to match.
- The timing is the problem. In the month the chip index fell more than in any month since October 2008, $6.9bn went into the fund that moves three times as far.
- So a rebound in the index does not bring the account back at the same speed. Because the multiple is reset every day, the choppier the ride, the more the climb needed to get back grows on its own.
Scheduled for gradingAwaiting grading
Sources
- Original The Kobeissi Letter (@KobeissiLetter) · SK hynix tops the world in leveraged and inverse ETF assets · 2026-08-03
- Bloomingbit SK hynix $5.5bn, Micron $5.1bn, Nvidia $4.8bn, Tesla $3.7bn, chips $21bn in total, SOXL's July intake $6.9bn · 2026-08-03
- Tech Times From 22 June, SOXL down 63% and SOXX down 25%; the rise needed to get back to even is 170% and 33% · 2026-07-29
- Benzinga Record chip ETF inflows in the worst month since 2008, with the July drawdown tallied · 2026-07-20
Checked 2026-08-04. The leveraged and inverse asset figures and the July inflow are as tallied in the reports above; the declines and the rise needed to recover are measured as of 2026-07-29 and do not include the August rebound.
This author's record
- BearFunds that lend directly to Asian companies just raised the least in 12 years.…
- BearMargin Debt Hit a Record $1.5 Trillion, Much of It Concentrated in AI Leveraged…
- BullUS Equity ETFs Just Pulled In a Record $880 Billion. Is That Really Conviction,…